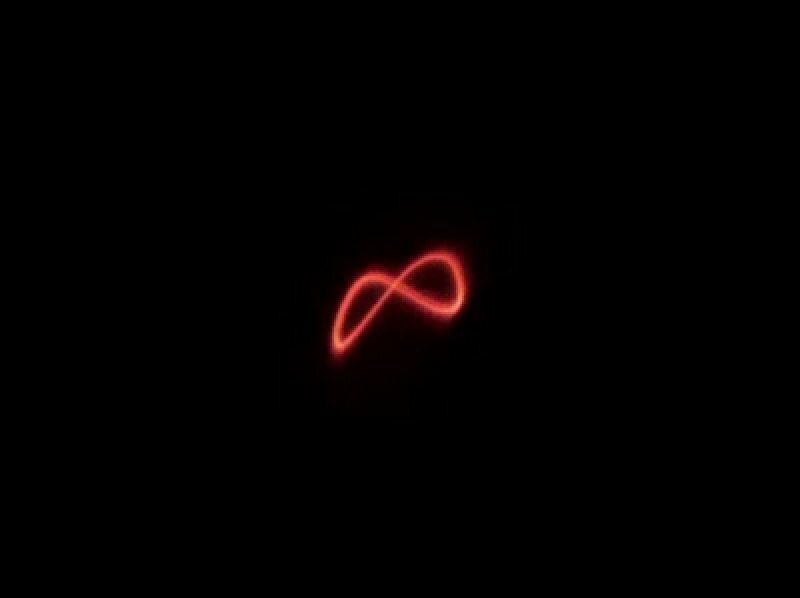
Sound and harmony made visible. Lissajous patterns made with 2 audio oscillators, a loud amplifier, plastic wrap, a bowl, and a laser pointer.
Easily mistaken for the infinity sign, a circle or any number of more complex pretzels and knots, the Lissajous Figure is a picture of compound harmonic motion named for French physicist and mathematician Jules Antoine Lissajous (1822-1880). The shape is drawn by plotting a two-variable parametric equation as it iterates itself over time – the resulting figure is the picture of two systems falling into and out of phase.
In 1855 Lissajous constructed his "beautiful machine," devised to draw a picture of two systems superimposed and constructed in his Paris workshop of a pair of tuning forks placed facing at right angles, each with a mirror attached. The light source is focused through a lens, bouncing off the first onto the second and projecting to a large screen a few feet away. As the tuning forks are struck and tones are produced, simple vibrations begin to move the mirrors in a regular oscillating pattern. The projected image begins to form the strange and beautiful curves of a Lissajous Figure.
For his machine Lissajous was awarded the Lacaze Prize in 1873 and was exhibited at the Paris Universal Exhibition in1867. He did not otherwise distinguish himself as a scientist or mathematician. In fact, almost fifty years earlier American Nathaniel Bowditch had already produced similar figures with his harmonograph.
The simple harmonic motion which Lissajous was measuring is easily described by the motion of a clock's swinging pendulum. As the pendulum swings its speed isn't constant, but rather it accelerates and decelerates following a precisely predictable curve. If plotted over time, as the clock ticks the motion of its pendulum draws a sine wave – the so-called "pure wave" or zero-picture of a simple moving system. Ocean waves, sound waves, light waves, even average daily temperatures all produce this same oscillating sine wave pattern.
Compound harmonic motion, then, is simply the superimposition of two sine waves as they register, interfere and produce a series of overlapping waves. When juxtaposed at right angles, two sine waves recording simple harmonic motion produce the surprisingly complex figures that Lissajous identified.
Sound and harmony made visible. Lissajous patterns made with 2 audio oscillators, a loud amplifier, plastic wrap, a bowl, and a laser pointer.
These two varying signals produce a perpetual infinity (figuratively and literally as it will actually construct itself in the shape of the infinity sign given the right initial values). The Lissajous Figure becomes a picture of timing and sequence, registration and resonance, sound and music.
Specific shapes are produced corresponding to the resonating harmonic intervals familiar from western music (major fifth, minor third, major sixth, etc.) Any figure may be transformed into any figure and an infinite number of in-betweens as the oscillating sine waves pass in and out of harmonic resonance.
Jules Antoine Lissajous created a way to see sound (using mirrors, light and vibrating tuning forks.) But the most radical possibility of his mathematics might be in the commitment it asks of its audience. The image that Lissajous produces forms slowly right in front of your eyes — imperceptibly changing, forming, adjusting and re-aligning over time.